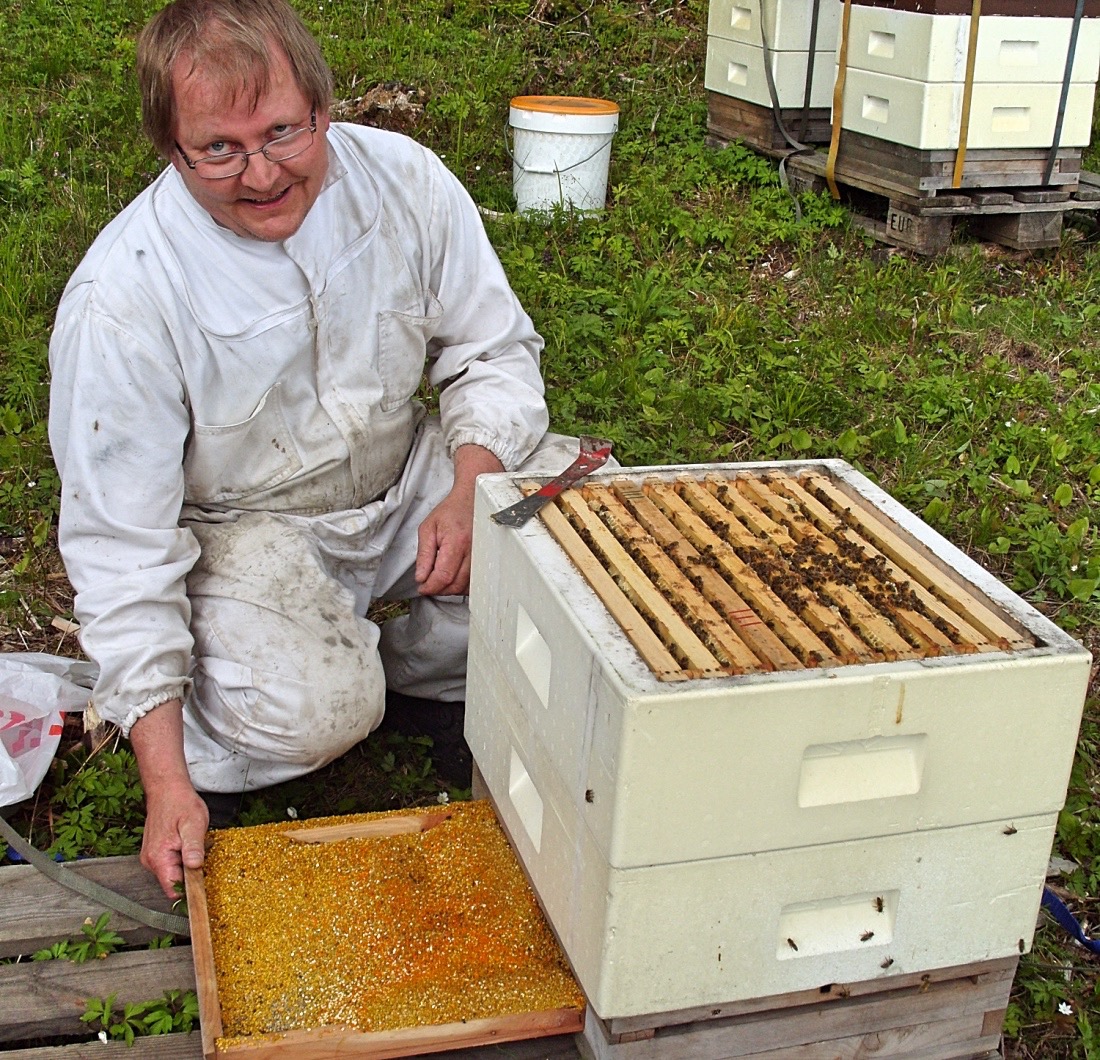
Hans-Otto Johnsen is a hard working Norweegian beekeeeper that is full of ideas to produce clean food with healthy pathogen resistant bees. Here harvesting pollen. He has bees that are Varroa resistant with low mite levels without treatment for since about 15 years. He is producing his own wax foundation with commercial quality. Here he writes about a cellsize test of his.
Norwegian cellsize test
Hans-Otto Johnsen, Norway:
Cellsize test 2002-2004
In 2002 I established a test apiary for testing small cell size. There were two groups of bee colonies in the test apiary. The two groups were placed as far away as possible in the apiary, but still close enough so that they together could be called an apiary.
The goal
The goal of the test was to observe the development of the Varroa population during the test and to measure the honey production.
The start
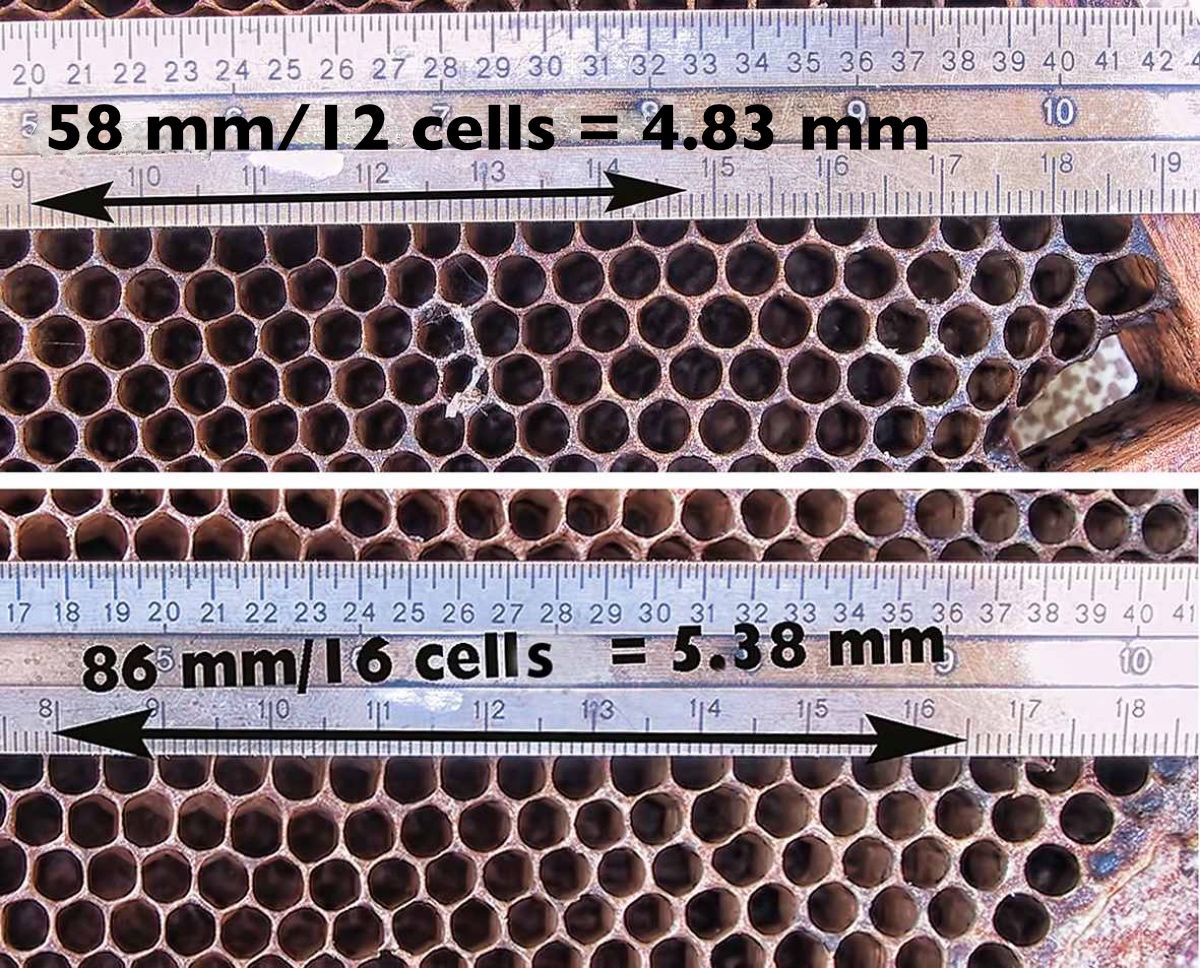
One group in the apiary had enlarged cell size (which have been "normal" for many years) in the brood area (5.5 mm – 55 mm measured over the parallel sides of ten cells). The other group was established on bees born in 5.1 mm cells.
The following year (2003) cell size was decreased to 4.9 mm in the small cell group.
All queens in the test apiary were sisters bred from the same colony. And they were all mated at the same isolated mating station with sister queens producing the drones. The breed was Buckfast (not Elgon).
I started with 20 colonies in each group, with the two groups 200 meters apart to avoid robbing and drifting between the groups. To further avoid unwanted influence harvest was done late in the day, escape boards were used and entrances were reduced.
Late in autumn 2002 when there was no brood, the test colonies were treated with oxalic acid. The aim of this treatment was to even out the mite population and start with a low amount of mites the coming season.
Drawing 4.9 mm cellsize wax foundation
The small cell colonies at first did not draw the 4.9-foundation well. Uneven cell sizes appeared though quite some patches were of good appearance. The least good drawn combs were replaced as soon as possible with new 4.9 foundation and the bees drew them better and better.
When the small cell group was given new foundation, the big cell group also was given new foundation (then of course of 5.5 mm cell size). Because of the given circumstances just a few measurements were made in 2003. An alcohol wash in October when no brood was at hand showed a lower amount of mites among the small cell colonies.
How to measure cellsize.
Results in 2004
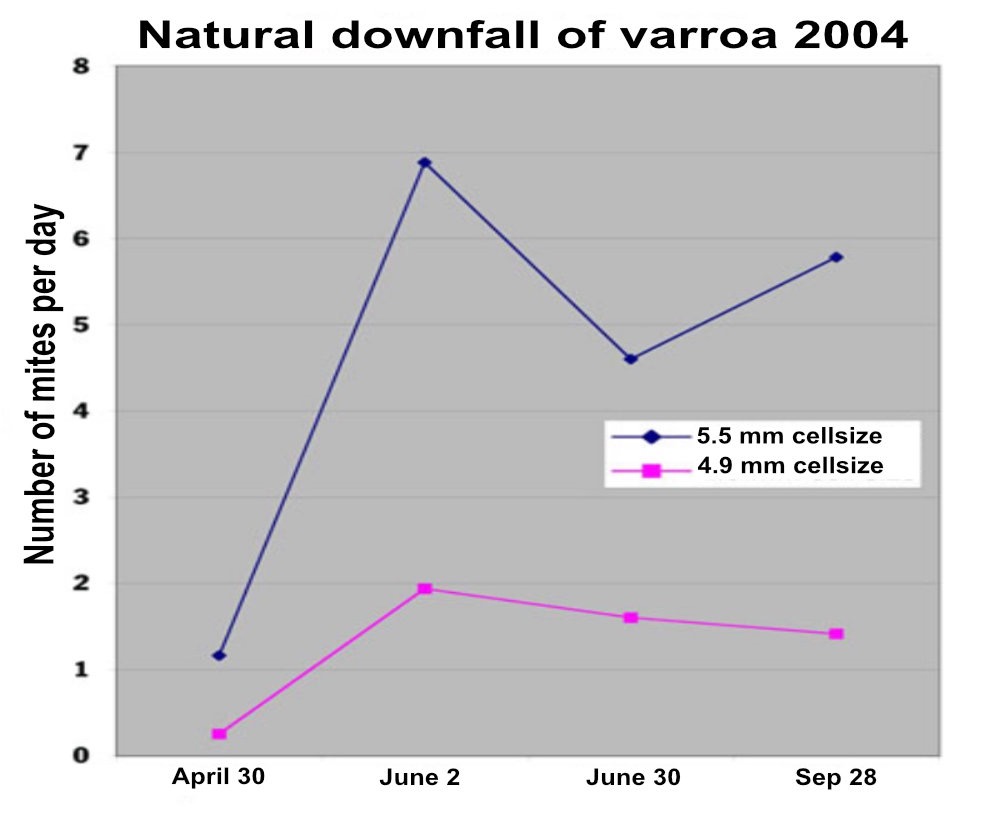
The mite population was throughout the season in 2004 significantly lower in the small cell group. See figure 1. The natural downfall in average in the small cell group peaked at 2 mites per day and then decreased steadily. In the large cell group it peaked at 7 mites a day, decreased and then increased again.
Figur 1
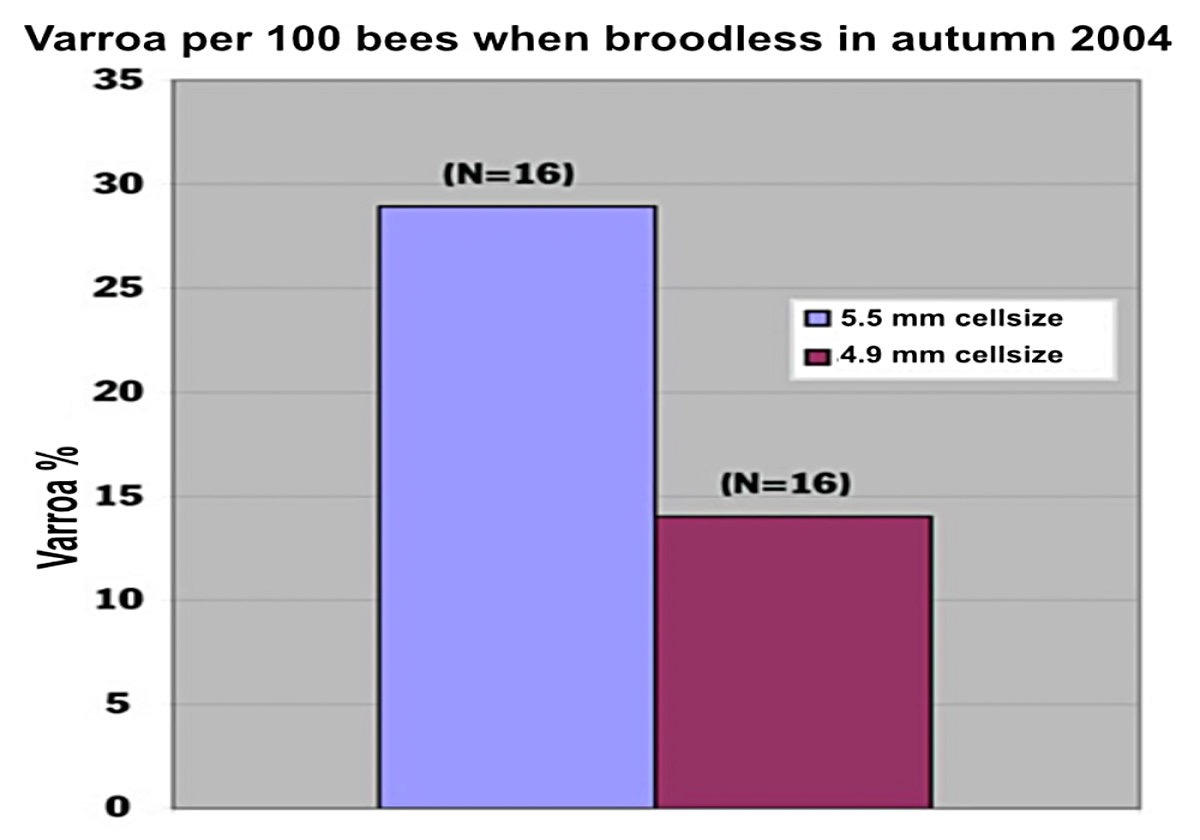
An alcohol wash was made in autumn when no brood was present in the colonies. See figure 2.
In the small cell group mites per 100 bees (%) was 14 (the range was 3-26%), and in the large cell group 29% (the range was 3-64%).
The 3% colony in the small cell group gave an average crop, while the one with 3% in the large cell group gave a very small crop telling us it was a weak colony, which it was.
The three 26% colonies in the small cell group and the 64% colony in the big cell group all gave good crops indicating strong colonies with good opportunities for the mite to reproduce.
Figur 2
The small cell group of colonies averaged about one box stronger at peak bee strength in the middle of summer.
The average honey crop in the large cell group was 36 kg (79.2 lbs.), range 8-57 kg (17.6 – 125.4 lbs.).
In the small cell group it was 24% bigger with 44,5 kg, range 23-62 kg.
An interesting observation was that the honey crop from the small cell colonies were more even, besides the top colony and a few at the bottom. The rest were very similar, while in the large cell group the crops were more spread out in size. The top crops were similar in the two groups.
Both groups were affected by chalkbrood. Chalkbrood is difficult to measure, but my anecdotal eyes told me the large cell group was evidently more affected. This may have contributed to the smaller crop in this group. Would the mite population had been bigger without the chalkbrood?
In September 2004 the queens were replaced in all remaining colonies, which was 16 in the small cell group and 16 in the large cell group. During the requeening, supersedure queens were found in 7 colonies in the small cell group and in 8 colonies in the large cell group.
Continuation of the test
The test continued the following year now with another breed, Norwegian carniolan. The results with me was similar as described here. There was also another test host as my test was a part of a joint test with the beekeeping association in Norway. Though the other test host managed his bees in a way so it differed too much from my management that it couldn't be viewed as being the same test.
For example not the same precautions were made concerning the real cellsize and to avoid drifting and robbing.
A short update 2006
My experiences this year confirmed what is written in this article. Winter losses was again low. And I saw less of mites in my operation. I have managed to shift to Elgon stock in almost all my colonies. The bees have done well even though the season was not very good.
This article is a part of the one published in Bee Culture nov 2005 and it can be read here:
What has happened in my operation during the following years can be read here: